


.png)
.png)


How to check your analytics in Willow
Learn how to use the Analytics tab and how to read your metrics
Your Analytics in Willow give you a clear overview of your channels' performance and a breakdown by channel. Additionally you can have a clear view of which posts worked well on your channels. This article covers each part of the Analytics figures that you can find in Willow.
Overview
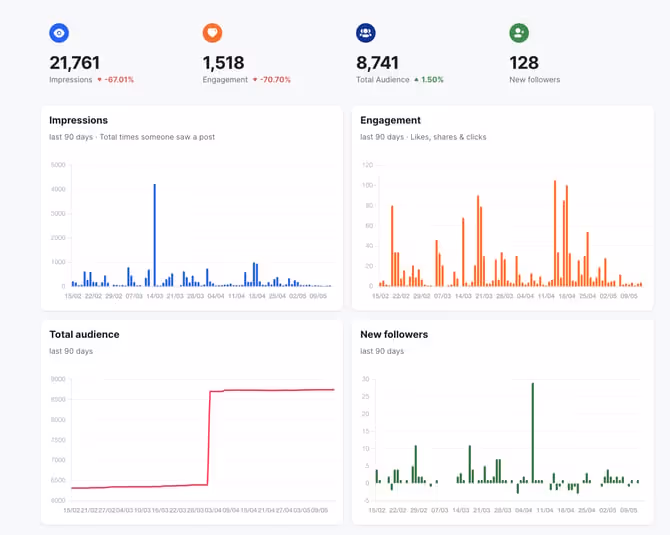
In the overview tab in your Willow account you can discover total data and metrics from all your channels or a breakdown per channel. You'll be able to see how many impressions and engagement you had as well as how many new followers you gained.
Analytics summary
The analytics summary gives you a clear overview of the following metrics: impressions, engagement, total audience and new followers.
Additionally, it gives you an indication of how much of an increase or decrease you had in comparison to a previous period of time.
The four graphs put the data into perspective and allow you to see the growth over a certain period of time.
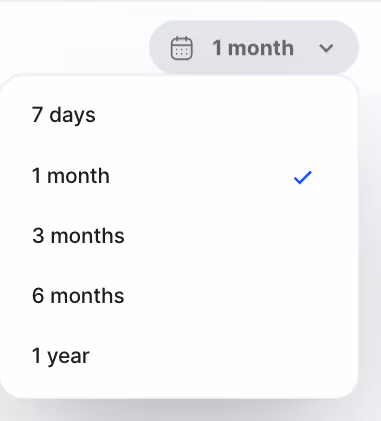
Change the reporting period
You can choose the period of time for the reports by clicking on the calendar button on the right top side. You now have the choice between 7 days, one month, three months, 6 months and a year. Mind that the growth will always be compared against the previous period of the same length. Take into account that we only have full data since you joined Willow. If you started using Willow four months ago, the three month period won't show an accurate comparison.
The default setting is one month.
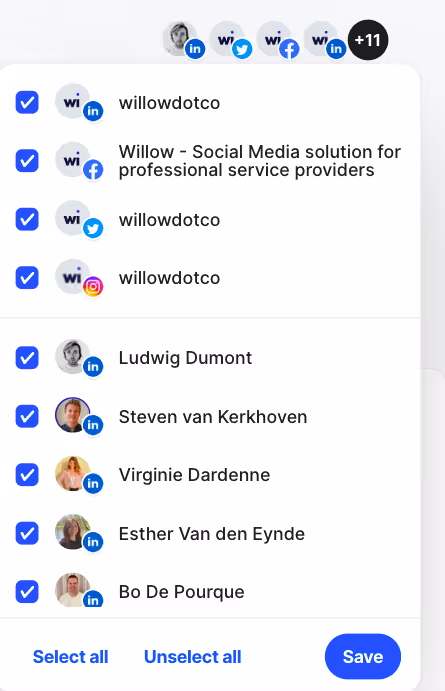
Choose your channels
You can also select specific social media channels in the top right corner, just under the calendar. This gives you the opportunity to see the social media metrics for a particular channel or group of channels.
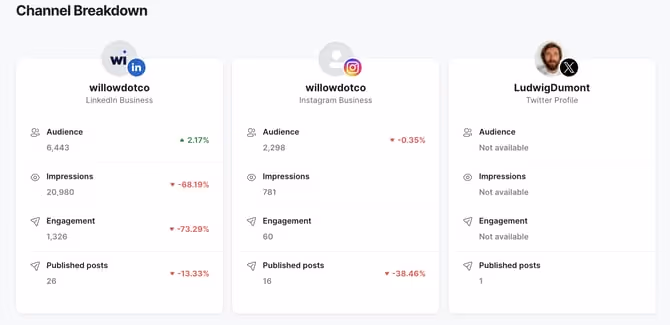
Channel breakdown
The channel breakdown section lists all your business accounts (not including personal pages) and gives you a short and clear overview of the audience, impressions, engagement and amount of published posts for this profile.
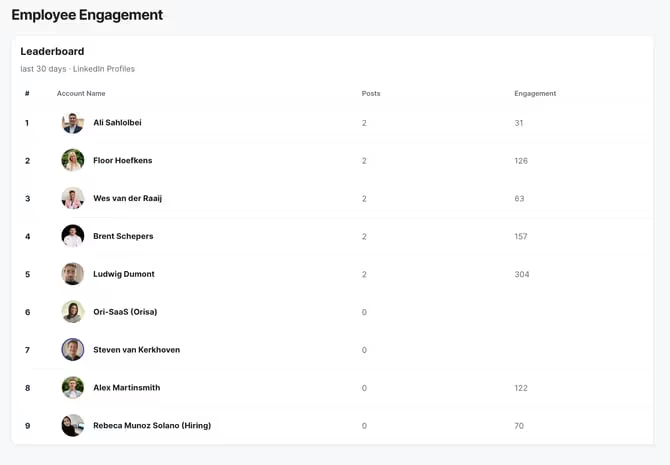
Employee Engagement
The employee engagement leaderboard lists all the connected personal LinkedIn profiles, how many posts they've made in the selected period and the total engagement.
All Posts
In the posts tab you the impact of each individual post in a handy table. The table shows the impressions, likes, comments, clicks, shares and engagement (sum of the previous metrics). Your engagement rate is the amount of engagements per view. For example, 100 engagements for 200 impressions, gives you an engagement rate of 50%.
Finally, you can also see which type of post this was in the attacments column. The three types of attachments are files (carousels), images and video. N/A means there was no attachment. If you see a question mark, this indicates a special type of post such as an article or a poll.
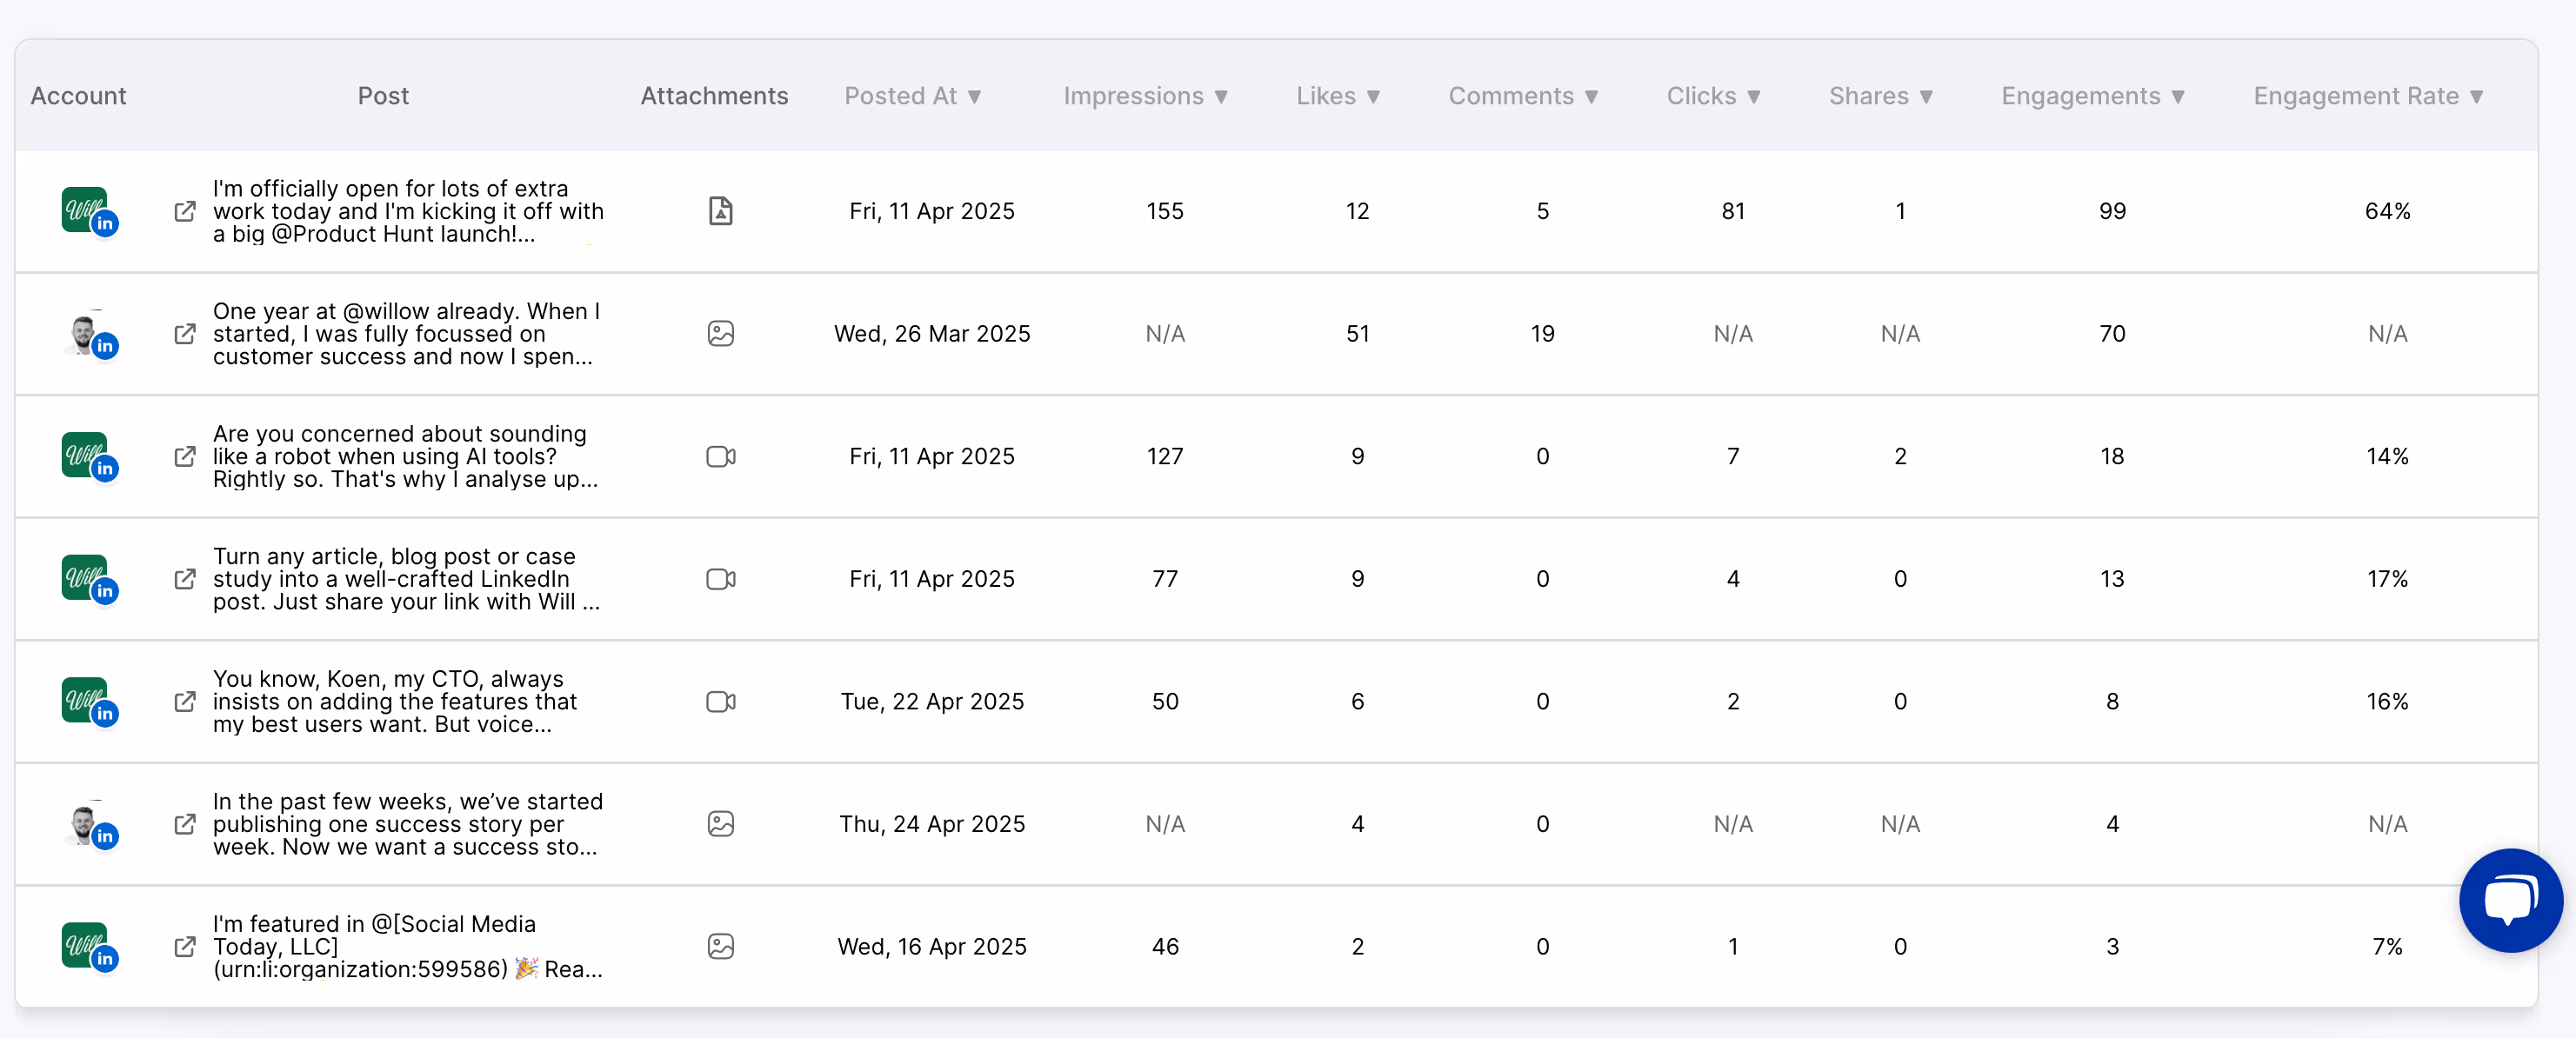
You can also modify the table by selecting a different timeframe and choosing the different channels you want to review.
The posts are automatically sorted by highest impressions, but you can rearrange them by clicking the arrow next to the name of each metric.